Isma (2003) FACT SHEET: Muslim & Arab Australians in South Australia
Consultations Homepage || Fact Sheet
FACT SHEET: Muslim & Arab Australians in South Australia
1. Muslim Australians
- Total number of Muslims in Australia: 281,578
- Total number of Muslims in South Australia: 7,478
- Proportion of the Australian population who are Muslim: 1.5%
- Proportion of the Queensland population who are Muslim: 0.5%
*Source: Australian Bureau of Statistics (ABS), 2001 Census.
Figure 1: Australian Muslim population by state and territory
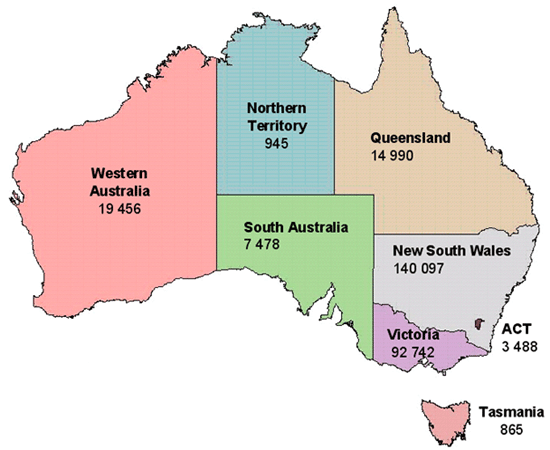
Source: ABS, 2001 Census. Basic Community Snapshots and Profiles.
Click here for text only version.
Table 1: Geographic Distribution of Muslims in Australia, 2001
|
State/territory
|
Proportion of all Australian Muslims
|
Proportion of total state or territory population
|
| New South Wales | 50% | 2.2% |
| Victoria | 33% | 2.0% |
| Western Australia | 7% | 1.1% |
| Queensland | 5% | 0.4% |
| South Australia | 3% | 0.5% |
| Australian Capital Territory | 1% | 1.1% |
| Northern Territory | 0.3% | 0.5% |
| Tasmania | 0.3% | 0.2% |
Total |
100% |
1.5% |
Source: ABS, 2001 Census.
Table 2: Distribution of Australian Muslims by major statistical local areas in Adelaide, 2001
| Statistical local area | Number |
| Salisbury (C) - South-East | 459 |
| Charles Sturt (C) - North-East | 451 |
| West Torrens (C) - East | 414 |
| Port Adel. Enfield (C) - Port | 409 |
| Port Adel. Enfield (C) - Inner | 337 |
| Port Adel. Enfield (C) - East | 307 |
| Charles Sturt (C) - Inner East | 303 |
| Tea Tree Gully (C) - South | 295 |
| West Torrens (C) - West | 289 |
| Mitcham (C) - West | 240 |
| Marion (C) - North | 213 |
| Marion (C) - Central | 183 |
| Adelaide (C) | 160 |
| Campbelltown (C) - West | 156 |
| Burnside (C) - North-East | 135 |
| Charles Sturt (C) - Inner West | 133 |
| Prospect (C) | 119 |
| Campbelltown (C) - East | 117 |
| Salisbury (C) - Central | 114 |
| Norw. P'ham St Ptrs (C) - East | 112 |
| Burnside (C) - South-West | 102 |
| Onkaparinga (C) - Morphett | 98 |
| Onkaparinga (C) - Reservoir | 98 |
| Tea Tree Gully (C) - North | 96 |
| Charles Sturt (C) - Coastal | 95 |
| Unley (C) - East | 92 |
| Unley (C) - West | 90 |
| Norw. P'ham St Ptrs (C) - West | 89 |
| Marion (C) - South | 84 |
| Mitcham (C) - Hills | 84 |
| Onkaparinga (C) - Woodcroft | 79 |
| Salisbury (C) - Inner North | 76 |
| Port Adel. Enfield (C) - Coast | 74 |
| Holdfast Bay (C) - North | 70 |
| Tea Tree Gully (C) - Central | 69 |
| Mitcham (C) - North-East | 59 |
| Salisbury (C) - North-East | 40 |
| Playford (C) - Elizabeth | 39 |
| Holdfast Bay (C) - South | 34 |
| Walkerville (M) | 29 |
| Playford (C) - West | 27 |
| Salisbury (C) Bal | 27 |
| Onkaparinga (C) - South Coast | 26 |
| Playford (C) - West Central | 20 |
| Onkaparinga (C) - North Coast | 18 |
| Onkaparinga (C) - Hackham | 16 |
| Adelaide Hills (DC) - Central | 15 |
| Onkaparinga (C) - Hills | 12 |
| Playford (C) - East Central | 11 |
| Gawler (M) | 8 |
| Adelaide Hills (DC) - Ranges | 8 |
| Tea Tree Gully (C) - Hills | 7 |
| Playford (C) - Hills | 6 |
| Total for Adelaide SD | 6644 |
*Source: ABS 2001 Census, Unpublished Data.
2. Arab & Middle-Eastern Australians
Definitions
Defining who is an ‘Arab’ or exactly which countries lie within the Middle East is a complex matter.
The Australian Bureau of Statistics (ABS) defines the Middle East as: Bahrain, Gaza Strip and West Bank (Palestine), Iran, Iraq, Israel, Jordan, Kuwait, Lebanon, Oman, Qatar, Saudi Arabia, Syria, Turkey, United Arab Emirates, Yemen. North Africa is defined as: Algeria, Egypt, Libya, Morocco, Sudan, Tunisia and the Western Sahara. ‘Arab’ includes: Algerian, Egyptian, Iraqi, Jordanian, Kuwaiti, Lebanese, Libyan, Moroccan, Palestinian, Saudi Arabian, Syrian, Tunisian.
This summary uses ABS definitions and highlights specific countries of origin for a significant number of Australians. These countries are: Lebanon, Egypt, Turkey, Iraq, Iran, Syria and Israel. Other Middle Eastern, North African and Arab countries with much smaller representation in Australian are grouped into two categories:
- ‘Other Middle East’ (which includes Bahrain, Jordan, Kuwait, Oman, Palestine, Qatar, Saudi Arabia, United Arab Emirates and Yemen)
- ‘Other North Africa’ (which includes Algeria, Libya, Morocco, Sudan, Tunisia, Mauritania, Djibouti and Western Sahara)
- Total number of Australians born in the Middle East or North Africa in Australia: 213,940
(1.1% of the national population) - Total number Australians born in the Middle East (5,257) or North Africa (1,544) in South Australia: 6,804 (0.5% of the S.A. state population).
*Source: Australian Bureau of Statistics (ABS), 2001 Census.
Note: 3 people did not specify whether they were specifically born in the region of the Middle East or North Africa.
Figure 2: State & territory distribution of Australians born in the Middle East & North Africa, 2001
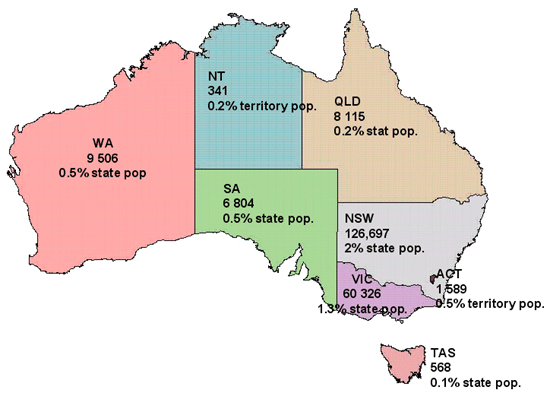
Source: ABS, 2001 Census. Basic Community Profiles and Snapshots.
Click here for text only version.
Table 3: Australians born in the Middle East or North Africa in major statistical areas of Adelaide, 2001
|
Statistical Local Area
|
Egypt
|
Iran
|
Iraq
|
Lebanon
|
Syria
|
Turkey
|
Other Middle East
|
Other North Africa
|
Total
|
| West Torrens (C) - East |
46
|
54
|
62
|
47
|
7
|
7
|
13
|
48
|
284
|
| Campbelltown (C) - East |
35
|
76
|
6
|
91
|
6
|
21
|
22
|
24
|
281
|
| West Torrens (C) - West |
46
|
63
|
33
|
23
|
10
|
15
|
4
|
35
|
229
|
| Marion (C) - Central |
58
|
64
|
7
|
49
|
9
|
18
|
18
|
6
|
229
|
| Port Adel. Enfield (C) - Inner |
20
|
19
|
56
|
65
|
3
|
8
|
9
|
37
|
217
|
| Mitcham (C) - West |
23
|
65
|
0
|
89
|
14
|
15
|
3
|
5
|
214
|
| Salisbury (C) - South-East |
33
|
14
|
20
|
102
|
18
|
8
|
12
|
3
|
210
|
| Port Adel. Enfield (C) - East |
21
|
69
|
22
|
38
|
0
|
18
|
23
|
14
|
205
|
| Tea Tree Gully (C) - South |
21
|
16
|
29
|
92
|
3
|
14
|
15
|
11
|
201
|
| Onkaparinga (C) - Woodcroft |
46
|
86
|
11
|
34
|
0
|
6
|
6
|
3
|
192
|
| Burnside (C) - North-East |
26
|
69
|
5
|
48
|
0
|
19
|
9
|
7
|
183
|
| Charles Sturt (C) - North-East |
26
|
21
|
28
|
71
|
6
|
4
|
15
|
10
|
181
|
| Marion (C) - South |
53
|
67
|
7
|
13
|
0
|
5
|
21
|
5
|
171
|
| Onkaparinga (C) - Morphett |
25
|
51
|
5
|
54
|
3
|
5
|
4
|
4
|
151
|
| Onkaparinga (C) - Reservoir |
10
|
94
|
0
|
19
|
5
|
6
|
7
|
4
|
145
|
| Burnside (C) - South-West |
28
|
39
|
4
|
49
|
0
|
0
|
9
|
6
|
135
|
| Campbelltown (C) - West |
30
|
22
|
0
|
52
|
3
|
17
|
7
|
3
|
134
|
| Marion (C) - North |
35
|
24
|
10
|
35
|
0
|
11
|
10
|
7
|
132
|
| Charles Sturt (C) - Inner West |
35
|
9
|
6
|
26
|
4
|
15
|
13
|
21
|
129
|
| Prospect (C) |
18
|
20
|
16
|
20
|
3
|
14
|
4
|
32
|
127
|
| Norw. P'ham St Ptrs (C) - East |
18
|
38
|
5
|
16
|
0
|
31
|
9
|
10
|
127
|
| Charles Sturt (C) - Inner East |
18
|
28
|
21
|
15
|
10
|
13
|
4
|
13
|
122
|
| Mitcham (C) - Hills |
19
|
35
|
3
|
47
|
3
|
4
|
7
|
3
|
121
|
| Charles Sturt (C) - Coastal |
47
|
24
|
7
|
13
|
3
|
9
|
11
|
3
|
117
|
| Salisbury (C) - Central |
21
|
4
|
0
|
54
|
9
|
11
|
8
|
7
|
114
|
| Adelaide (C) |
14
|
29
|
11
|
13
|
3
|
15
|
17
|
9
|
111
|
| Tea Tree Gully (C) - North |
19
|
38
|
4
|
4
|
11
|
16
|
11
|
0
|
103
|
| Tea Tree Gully (C) - Central |
5
|
25
|
4
|
36
|
17
|
0
|
6
|
3
|
96
|
| Port Adel. Enfield (C) - Port |
6
|
22
|
17
|
27
|
0
|
6
|
3
|
15
|
96
|
| Unley (C) - East |
15
|
38
|
3
|
15
|
0
|
6
|
7
|
0
|
84
|
| Norw. P'ham St Ptrs (C) - West |
19
|
17
|
5
|
6
|
3
|
15
|
3
|
10
|
78
|
| Salisbury (C) - North-East |
6
|
0
|
7
|
38
|
4
|
3
|
10
|
3
|
71
|
| Total |
1021
|
1389
|
429
|
1430
|
171
|
429
|
397
|
399
|
5665
|
*Source: ABS, 2001 Census, Unpublished data.
Note: Columns do not total as data provided for select SLAs.
Race Discrimination Unit, Human Rights and Equal Opportunity Commission, July 2003. ABS data used with permission from the Australian Bureau of Statistics.