A Bad Business - Part C: Findings
A Bad Business
(Review of sexual harassment in employment complaints 2002)
Part C: Findings
4.
The nature of harassment
The majority of reported sexual harassment
was targeted at women, involved multiple forms of harassing behaviour
and occurred on more than one occasion. In over one in five cases, the
harassment continued for more than 12 months. Verbal harassment was
often a precursor to physical forms of harassment.
4.1 Gendered nature of harassment
The sexual harassment that is reported
to HREOC is gendered. The majority (86 per cent) of complaints involved
a man sexually harassing a woman (131 complaints). Women harassing men
was a rare occurrence (three per cent or five complaints), while same
sex harassment was also infrequent (one per cent for males, or two complaints
and two per cent for females which was three complaints). Seven per
cent of complaints (10 complaints) involved men and women harassing
women, while one per cent of complaints (one complaint) involved men
and women harassing a man.
4.2 Type of harassment complained about
While some complainants detailed only
one type of harassing behaviour, most complaints involved a number of
categories of harassing behaviours. [20] Verbal harassment is most prevalent, however this form of harassment
was often a precursor to physical harassment. As such, verbal harassment
may be an early warning of other forms of harassment.
Verbal harassment represented 36 per
cent of all harassment and occurred in 71 per cent of complaints. Physical
intimacy was the next most frequently complained of form of harassment
and occurred in more than one in three complaints. [21] Sexual physical behaviour represented 12 per cent of the harassment
complained about and occurred in 23 per cent of complaints. [22] Some of the general bullying behaviour reported was in response to complainants
reporting the harassment within the workplace.
Complaints involving a particular
behaviour
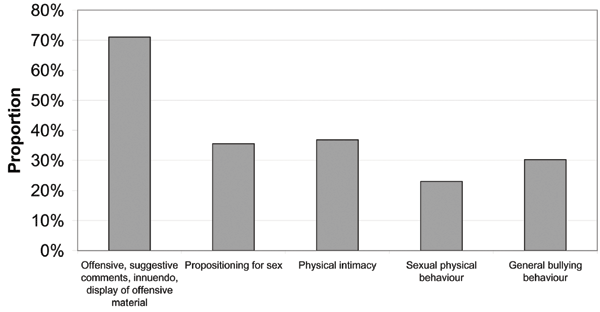
Note: the proportion adds to more
than 100 per cent as most complaints involved a number of categories
of harassing behaviour.
4.3 Duration of harassment
Sexual harassment does not have to
be repeated or continuous to be unlawful. The legislation is drafted
in the singular (for example, “an unwelcome sexual advance”
and “an unwelcome request for sexual favours”). This is
supported by the case law. [23]
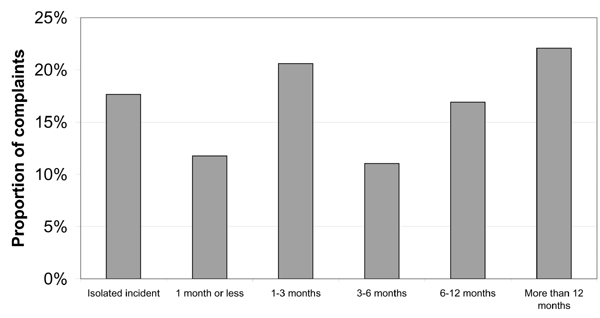
Of the 136 complaints from which the
duration of the sexual harassment could be discerned, 24 cases or 18
per cent reported sexual harassment constituted by a single incident.
Harassment that continued over a significant period was the most prevalent,
with 22 per cent of harassment continuing for more than 12 months. Twenty-one
per cent of harassment occurred over one to three months. The longest
period of harassment recorded was 156 months (13 years), however the
complainant first complained about the behaviour 140 months after it
had commenced.
Duration of harassment
5. Characteristics of complainants
and individual respondents
The data show that the overwhelming
majority of those who reported sexual harassment were women, and that
they were reporting harassment by men. Complainants were on average
12 years younger than individual respondents. Three quarters of individual
respondents were aged over 30 years while over half of complainants
were 30 years or less. However, the data on age of complainants and
respondents should be used with caution given the small number of complaints
where this information was available. Individuals who reported sexual
harassment were more likely to be Australian born, to have Australian
born parents and to speak English at home compared to the general population.
5.1 Sex of complainants and individual
respondents
Complainants
Of the 152 complaints of sexual harassment
in employment, 95 per cent of the complainants were female.
Individual respondents
Of the 152 complaints of sexual harassment
in employment, 88 per cent of the individual respondents were male,
five per cent were female and seven per cent involved both male and
female respondents.
5.2 Age of complainants and individual
respondents
Complainants
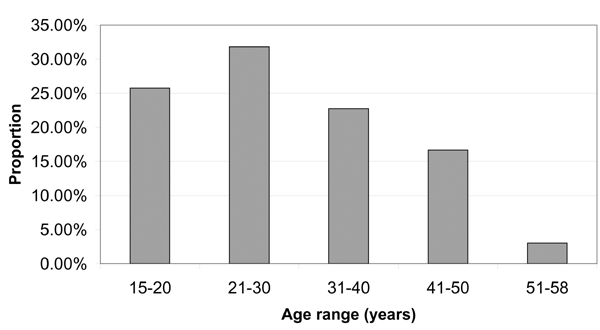
Of the 152 complaints analysed, 66
contained information about the complainant’s age.[24] The following data are based on those 66 complaints.
The youngest complainant was aged
15 years at the time that the harassment occurred and the oldest complainant
was aged 58 years at the time the harassment occurred. The average age
(mean), median age (the middle value of the range) and the mode (most
common age) for complainants were all similar at 30 years, 29 and 29
respectively. Fifty-eight per cent of complainants were aged 15-30 years.
Younger people are overrepresented
in the complaints data compared to the Australian labour force. For
example, eight per cent of the labour force are aged 15-19 years, while
26 per cent of complainants are aged 15-20 years. [25] Similarly 43 per cent of the labour force was aged 15-34 years old,
while 58 per cent of complainants were aged 15-30 years. [26]
Age of complainants
Individual
respondents
The individual respondent’s
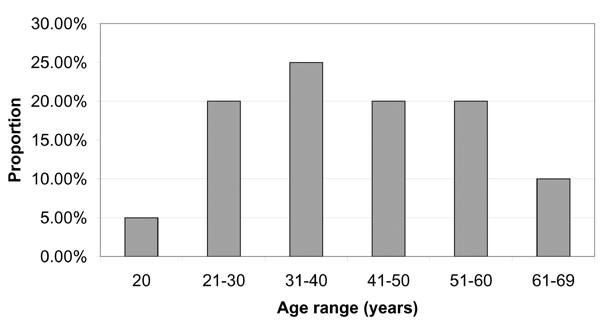
age was contained in the complaint file in 21 cases. [27] In an additional 19 cases, while the age of the respondent was not provided,
it was possible to infer from the information contained in the file,
whether the respondent was older or younger than the complainant. [28]
The youngest respondent was aged 20
years and the oldest respondent aged 69 years. The average age (mean)
and median age (the middle value of the range) of respondents were similar
at 42 years and 41 years respectively. The modes (most common age) were
30, 42, 48, 56 and 69 years. This reflects the relatively even spread
of respondents’ ages across the range 20 to 69 years. Seventy-five
per cent of respondents whose age was known were over 30 years.
Age of respondents
Comparison
The average age of respondents was
12 years older than that of complainants.
|
Complainants
|
Individual
respondents |
|
| Number of cases where age recorded |
66
|
21
|
| Average age |
30.08
|
42.15 years
|
| Median |
29
|
41 years
|
| Mode |
29
|
30, 42, 48, 56 and 69 years
|
| Standard deviation |
10.60
|
14.69
|
More limited data were available that
directly compared the ages for the individual respondent and complainant
within a complaint.
There were only 13 complaints where
the ages of both parties were explicitly provided. Of these 13, there
were two cases of the respondent being younger than the complainant,
one by seven years and the other by 18 years. In both cases the complainant
was female and the respondent male. Of the 11 cases where the respondent
was older than the complainant, the age difference ranged from 2 years
to 54 years. In 10 of these 11 cases, the complainant was female and
the respondent male while in one case the complainant was male and the
respondent was female. It should be noted, however, that in complaints
of sexual harassment where the complainant is relatively young, and/or
the age difference between the complainant and respondent is significant,
the ages of both are more likely to be provided. This may be due to
the fact that a significant age gap between the complainant and respondent
increases the severity of the alleged harassment. [29] As such, caution is needed in extrapolating from these data.
Of the additional 19 complaints where
a difference in the ages between complainants and respondents could
be discerned, the respondents were older than the complainants in 16
cases. Of these 16 cases, in all but one, the respondent was male and
the complainant female. In the other case, the complainant was male
and the respondent was female. Of the three cases where the respondent
was younger than the complainant, all three respondents were male and
all three complainants were female.
5.3 Ethnicity of complainants
Country of birth
Australian-born complainants are
overrepresented in the complaints data. Of the two-thirds of complaints
(100 complaints) where country of birth was provided 83 per cent of
complainants were Australian born. Two complainants (two per cent) identified
themselves as Aboriginal. In June 2000, 76 per cent of the Australian
population was Australian born. [30]
Parents’ country
of birth
Complainants with at least one parent
born overseas are underrepresented in the complaints data. Of the 70
complaints where parents’ country of birth was provided, 45 complainants
(64 per cent) stated that their mother was Australian born, and 47 complainants
(67 per cent) stated that their father was Australian born. Fifteen
(18 per cent) of Australian born complainants had at least one parent
born overseas. In contrast, in 1996 27 per cent of persons born in Australia
had at least one overseas-born parent. [31]
Language spoken at home
Individuals from a non-English speaking
background are underrepresented in the complaints population. Of the
70 complaints where this information was provided, there were only seven
complaints (10 per cent) where a language other than English was spoken
at the complainant’s home. The languages other than English were
French, Italian, Hindi, Pidgin, Spanish, Arabic and Greek. In 2001,
16 per cent of the Australian population spoke a language other than
English at home. [32]
6. Complainants’ employment
Reported harassment tended to occur
in the first few months of a complainant’s employment, involved
harassment by a more senior person in the workplace and was targeted
at particular occupations. Most complainants had resigned or been dismissed
at the time the complaint was made to HREOC.
6.1 Employment status of complainants
at time of harassment
Of the 143 complaints where employment
status was able to be determined, the majority of complainants were
employed full-time (58 per cent). [33] Of the remainder, 27 per cent were classified as casuals, nine per cent
were part-time and six per cent were on a fixed term contract. It is
difficult to draw conclusions on the basis of these data. In particular,
a comparison cannot be made with Australian Bureau of Statistics (ABS)
data as the complainants have not been classified consistently with
ABS recorded data. [34]
6.2 Length of complainants' employment
at first incidence of harassment
Reported harassment is far more likely
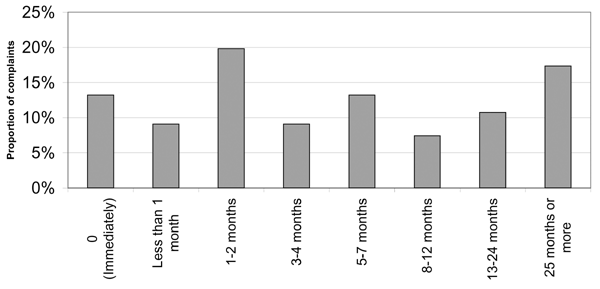
to occur early on in a complainant’s employment. Amongst the 121
cases where this could be determined, 72 per cent of complainants reported
that the harassment occurred in the first 12 months of the complainant’s
employment, with 11 per cent reporting that it occurred in the second
year and 17 per cent reporting that it occurred in the third year or
later. [35] In just over half of the
complaints, the first incidence of reported harassment occurred within
the first four months of the complainant’s employment.
Length of complainant's employment
at first incidence of harassment
6.3 Employment status of complainants
at time complaint made to HREOC
The data on complainants’ employment
status provide an indication of the disruption to the workforce caused
by incidences of sexual harassment and of the inherent costs for the
employer such as employee absenteeism and employee turnover.
Seventy-seven per cent of all complainants
were no longer actively working for the organisation where the alleged
harassment occurred, having either left their employer, or taken leave. [36]
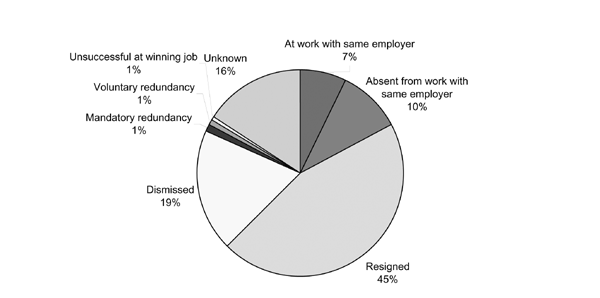
Almost half (45 per cent) of the complainants
had resigned from their employment at the time of making a complaint
to HREOC. Nineteen per cent of complainants had been dismissed from
their employment. The high percentage (67 per cent) of complainants
who left their position in connection with the reported sexual harassment
suggest staff turnover is one direct cost that is borne by employers.
Even amongst the small proportion
of complainants who were still with the same employer, the reported
sexual harassment affected staff productivity. For example, of the 17
per cent of complainants (26 complainants) who were still with the same
employer at the time of making a complaint to HREOC, 14 (54 per cent)
were absent from work receiving workers’ compensation, one (four
per cent) was absent from work on leave without pay and sick leave,
two (eight per cent) had transferred to another area with the same employer
and one (four per cent) had changed shifts.
It should be noted that information
about the employment status of individual respondents was generally
not available on the face of the complaint file. See also section 8.3
for disciplinary outcomes for individual respondents.
Employment status of complainant
at time complaint made to HREOC
6.4 Complainants’ occupation
Of the 146 complainants whose occupation
was known, approximately half (51 per cent) were employed in four occupational
groups: clerical, hospitality, shop assistant and labourer. [37]
Almost one in four complainants were
employed in clerical work, including as secretaries, administrative
assistants, office administrators, clerks, clerical administrators,
personal assistants and receptionists. Twelve per cent of complainants
were employed in the hospitality area, in positions such as bartenders,
waitresses, kitchen hands, restaurant managers and chefs. The next most
common grouping was shop assistant or sales assistant which accounted
for nine per cent of complainants. Seven per cent of complainants were
labourers, packers and stockpersons.
The occupational categories of clerical,
sales and service workers are overrepresented in the complaints data.
These occupations accounted for 31 per cent of the Australian workforce [38] compared to 45 per cent of complainants. However,
given that the majority (95 per cent) of complainants were women, the
complaints figures are likely to reflect the gender segregated nature
of the Australian workforce and the concentration of women in these
occupations. Fifty-one per cent of all women employees were employed
as clerical, sales and service workers in their main job. [39] The greater proportion of women who work as clerical, sales and service
workers equates to greater incidence of harassment being reported in
these occupations given that women are far more likely to report sexual
harassment than men.
6.5 Employment relationship of individual
respondents to complainants
The data reflect an imbalance in power
relations between the individual respondent and complainant, with 60
per cent of 161 respondents in a more senior position in the workplace
relative to the complainant. [40] Just over one third
(34 per cent) of respondents were co-workers of the complainant.
Employment relationship of respondent(s)
to complainant
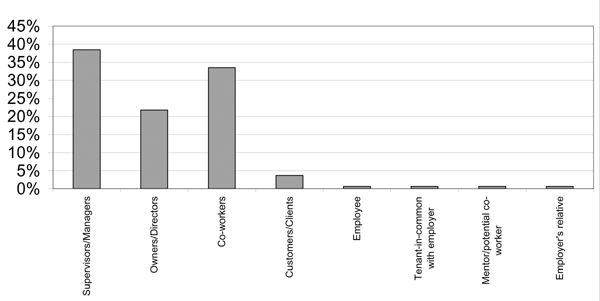
Note: Occasionally more than one respondent
per complaint
7. Characteristics of workplaces
The data show that sexual harassment
remains a problem across employer types, regardless of employer size,
industry and location.
7.1 Employer size
The size of the employer or workplace
where the sexual harassment occurred could be discerned from 135 of
the 152 complaints analysed. Complaints of sexual harassment were more
likely to emanate from small businesses according to HREOC’s sample
of complaints.
In addition, in comparison to the
proportion of the Australian population employed in small, medium and
large businesses, complaints from employees working in small businesses
appear slightly overrepresented and complaints from employees in large
businesses are slightly underrepresented. However, it should be noted
that the ABS classifies small business as employers with 1-19 employees,
while for the purposes of this review a small employer was defined as
one with 1-24 employees. This difference in classification may explain
the slight overrepresentation of small business in this review.
|
Size of employer
|
Proportion of |
Proportion of
complaints 2002 |
|
Small
|
38% (1-19 employees)
|
44% (1-24 employees)
|
|
Medium
|
23% (20-99 employees)
|
19% (25-99 employees)
|
|
Large
|
38% (100+ employees)
|
36% (100+ employees)
|
|
Total
|
5,912,200
|
135
|
7.2 Gender balance of workplaces
For 55 complaints it was possible
to establish that the complainant’s workplace was dominated by
one sex. Ninety-one per cent of these workplaces were male dominated. [43] These sexual harassment complaints
may reflect male exclusion of women from their traditional employment
domain. However, it is not possible to draw conclusions with any confidence
from such a small sample. Ninety-seven complaints were not classified.
7.3 Industry classification
Complaints were analysed and the industry
of the employer classified according to the Australian and New Zealand
Standard Industrial Classification (ANZIC). As the employer was identified
and the type of business generally described in each complaint, it was
possible to extrapolate the main industry in which the employer was
based from the material in the complaint file. The industry could not
be determined in four complaints due to the limited material in the
file about the employer. [44]
The most frequently occurring industry
was the Property and Business Services industry (14 per cent), followed
by Retail Trade (13 per cent), Accommodation, Cafes and Restaurants
(12 per cent), Manufacturing (11 per cent), Wholesale Trade (seven per
cent), and Transport and Storage (seven per cent).
Communication Services and Accommodation,
Cafes and Restaurants were both significantly overrepresented amongst
complaints, with the level of complaints being 2.9 and 2.4 times respectively
greater a proportion of complaints compared to their contribution to
total employment. The workforces in these industries are dominated by
women. Other industries that were overrepresented included Wholesale
Trade, Transport and Storage, Property and Business Services, Government
Administration and Defence, and Cultural and Recreational Services.
Education, Health and Community Services [45] and Agriculture, Forestry and Fishing were amongst those industries
that were underrepresented amongst complaints. It should be remembered
that these figures do not reflect the level of sexual harassment occurring
in each of these industries, but rather the level of harassment that
has been reported to HREOC.
7.4 Location of workplaces
The location of the workplace where
the harassment occurred could be determined for 150 of the complaint
files.
Nearly half of the sexual harassment
complaints occurred in NSW workplaces. However, the fact that complaints
of sexual harassment may also be made to State and Territory organisations
under State and Territory legislation means that the data are not very
informative on the distribution of reported harassment across Australia.
Two-thirds of the reported harassment
occurred in workplaces located in cities including capital cities and
major regional cities, 31 per cent occurred in rural areas and three
per cent was in remote rural areas.
8. Workplace responses to harassment
The majority of harassment complaints
had been reported within workplaces, to people in a management or supervisory
role, shortly after the harassment had occurred. Most small businesses
did not have a sexual harassment policy. While a significant number
of large and medium-sized businesses did have a sexual harassment policy,
this was not always implemented.
8.1 Reporting harassment in the workplace
Reporting of harassment
via internal mechanisms
In 130 complaints it was clear whether
or not the harassment had been reported via internal mechanisms. Amongst
these complaints, 78 per cent of complainants (102 complainants) had
reported the harassment internally.
Time between harassment
and reporting
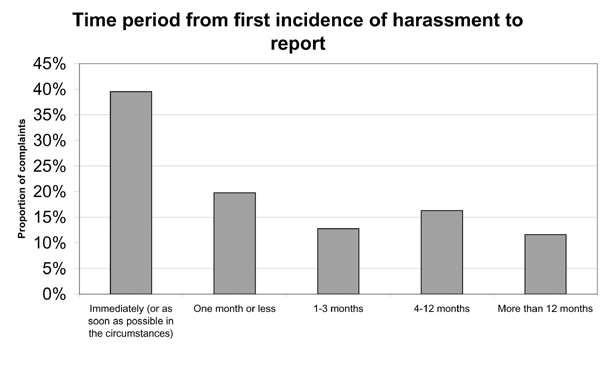
Of the 102 complainants who reported
the harassment internally, the period of time elapsing between the first
incidence of harassment and the reporting of it could only be discerned
from 86 complaint files. Almost three quarters of these complainants
reported the harassment within three months. Forty per cent of complainants
(34 complainants) reported the harassment immediately.
Time period from first incidence
of harassment to report
Person to whom harassment
was reported
The complaints data reveal that complainants
took their concerns to a variety of officers or agencies. [46]
- Thirty-five per cent of complainants reported
to a supervisor, manager or team leader. - Fourteen per cent of complainants reported to
a human resources manager or personnel manager. - Twenty-eight per cent of complainants reported
to a Director, CEO, General Manager, Management, [47] Board of Directors, Board of Management or the owner of the business. - Four per cent of complainants reported to a
harassment officer, equity officer or complaints hotline. - Eight per cent of complainants reported to the
alleged harasser. - Three per cent of complainants reported to another
internal person including in-house legal counsel, security and co-workers. - Eight per cent of complainants reported directly
to an external person or organisation (including police, union representative,
employer representative, employment agency, apprenticeship co-ordinator,
teacher and lifestyle co-ordinator).
Seventy-seven per cent of reporting
of harassment was to people in a management or supervisory role. This
indicates an expectation by complainants that senior people within an
organisation would address complaints of sexual harassment. However
since complaints were subsequently made to HREOC in these cases, this
also indicates that these managers and supervisors were unable to resolve
the complaints in these cases. This has significant implications for
business – indicating a need for managers and supervisors to be
prepared and able to handle complaints of sexual harassment.
The level of reporting to harassment
officers is surprisingly low (four per cent). There are a range of possible
explanations for this, including that most organisations do not have
a harassment officer; that harassment officers were better able to resolve
complaints and thus these complaints did not come to HREOC; or that
employees were not making full use of harassment officers. It is not
possible to determine which of these reasons apply from the available
data.
8.2 Sexual harassment policies
Existence of a sexual
harassment policy
Of the 152 complaints analysed, 125
(82 per cent) indicated whether there was a policy on harassment in
existence within the workplace or not. Of these respondent employers,
62 per cent indicated that they had a sexual harassment policy in existence.
Implementation of a sexual
harassment policy
Implementation of a sexual harassment
policy may include training of staff and management; display or publication
of the policy on billboards, websites or other prominent positions;
induction training and reference to sexual harassment policies in performance
management systems. While 62 per cent of respondent employers for whom
this information was available had a policy in place, just over one
in four (27 per cent) of those respondent employers had not fully implemented
their policies. This included not promoting the policy, not including
the policy in induction training and/or no recent training of managers
about the policy.
The majority of complaints involved
employers who had not implemented sexual harassment policies fully or
at all. Amongst all 152 complaints analysed, only 36 per cent (54 of
152 complaints) involved an employer who had a sexual harassment policy
that had been fully implemented. [48] Half of the employers either did not have a policy or had not implemented
the policy. This suggests there is significant scope for employers to
improve their preventative measures in relation to sexual harassment.
Relationship between size
of employer and existence and implementation of a sexual harassment
policy
The existence and implementation of
a sexual harassment policy was more common amongst larger business.
Eighty-six per cent of large employers, 69 per cent of medium-sized
employers and 10 per cent of small employers had a sexual harassment
policy. Amongst those organisations that had a sexual harassment policy,
88 per cent of large employers, 50 per cent of medium-sized employers
and 33 per cent of small employers had implemented the policy.
At first glance these figures suggest
that the existence of a sexual harassment policy has not helped larger
organisations to reduce the level of sexual harassment complaints in
their workplaces given that the proportion of complaints that HREOC
received from large businesses is similar to the proportion of the workforce
that is employed by large businesses. [49] However,
this does not take account of the fact that the existence of a policy
may increase awareness of the option of lodging a complaint with HREOC.
In addition, since conciliated complaints are agreements between the
parties to a complaint and not a determination that harassment has actually
occurred, this paper is not able to conclusively consider the extent
to which employers were vicariously liable for the harassment. The existence
of a sexual harassment policy may be used in litigation by larger employers
to establish that they had met their duty to their employees and taken
all reasonable steps to prevent the harassment from occurring.
HREOC has recommended that small businesses
have a written policy on sexual harassment in its publication Sexual
Harassment: A Code of Practice, [50] and that
either the owner of the small business or a responsible senior employee
be nominated as a sexual harassment complaints officer. This person
should be provided with any training or resources offered by employer
organisations, small business associations, industry associations, HREOC
or State or Territory anti-discrimination agencies. The facts that in
the complaints to HREOC, only one in 10 small employers had a sexual
harassment policy and of these only one in three had implemented the
policy suggest that small businesses, in particular, need to focus on
implementing preventative strategies in order to avoid vicarious liability. [51]
8.3 How harassment was dealt with in
the workplace
Informal or formal internal
complaint process
The existence of a formal or informal
internal complaints process could be determined in 116 of the 152 complaints.
Of this 116, a formal or informal internal complaints process existed
in 76 per cent of cases. There was no internal complaints process in
23 per cent of cases. [52]
It is surprising that the proportion
of complaints from organisations with an internal complaints process
is so high. Insufficient information is available on organisations’
complaints processes to be able to determine the reasons for these results.
In addition, it is difficult to draw conclusions from these data without
knowing the proportion of all workplaces which have an internal complaints
process.
Possible explanations for complaints
proceeding to HREOC despite the existence of an internal complaints
process include that the complaint handling processes, where they exist,
are not well implemented or that the existence of a complaints process
raises employees’ awareness of the HREOC complaint functions and
expectations of satisfactory outcomes.
Workplace response
Complaints of sexual harassment were
investigated by the employer in 62 per cent of the 111 cases where this
information could be determined. [53]
Disciplinary proceedings took place
in 34 per cent of those 111 cases (that is, in 38 cases). In 65 per
cent of cases (72 cases), disciplinary proceedings did not occur. There
was one case (one per cent) where the occurrence of disciplinary proceedings
was disputed between the parties to the complaint.
The most common disciplinary proceedings
were transferring the individual respondent (18 per cent), counselling
the individual respondent (15 per cent), giving an oral warning to the
respondent (12 per cent), giving a written warning to the respondent
(12 per cent), and resignation of the respondent (12 per cent). [54] The individual respondent was dismissed in two cases (six per
cent) and had to undertake training in one case (three per cent).[55] These figures do not indicate the effectiveness of the disciplinary
proceedings in changing the individual respondent’s behaviour
or acting as a disincentive for others.
Given that there was only one case
where an alleged harasser was required to undertake training as a result
of disciplinary proceedings, it would appear that there is scope for
increased use of training in response to complaints of sexual harassment,
particularly as a means of preventing reoccurrences of this behaviour.
However, warnings and counselling may serve as a sufficient indicator
that the particular behaviour is not acceptable in the workplace.
One in four complaints were alleged
to have been ignored within workplaces amongst the 67 complaints where
this could be determined.
Satisfaction with the
workplace process
Ninety-nine per cent of complainants
were not satisfied with the workplace process for handling sexual harassment
complaints amongst the 70 complaints where this could be determined. [56] Obviously, this is consistent with the expectation
that only those complainants who were not satisfied with how the complaint
was handled within the workplace would proceed to lodge a complaint
with HREOC. It underlines the importance of not just having an internal
complaints process, but also ensuring that the process is operating
well and meeting the expectations of staff.
9. Outcomes of complaints
Almost all complainants sought financial
compensation for the harassment they had experienced and more than one
in two sought an apology. A conciliation conference was held in over
half the complaints, with just over two out of three of these cases
settling as a result.
The most common ground for HREOC terminating
a complaint was that there was no reasonable prospect of settlement.
Very few complaints proceeded to litigation. [57]
9.1 Remedies
sought by complainants
Where the remedies sought by the complainant
were specified, 93 per cent sought financial compensation, 59 per cent
sought an apology, 38 per cent sought the introduction or enforcement
of preventative strategies, 11 per cent sought the provision of a reference
or work statement and six per cent sought the dismissal or demotion
of the harasser. [58] The
average amount of financial compensation sought by complainants was
approximately $45,000.
9.2 Outcome of complaints
Conciliation conferences were held
in 87 cases to attempt settlement of the complaints. Sixty-one complaints
(70 per cent) settled as a consequence of those 87 conciliation conferences.
Of the 152 complaints reviewed, 61
complaints (40 per cent) settled via a conciliation conference, 49 complaints
(32 per cent) were terminated, four complaints (three per cent) were
administratively closed, 12 complaints (eight per cent) were withdrawn
and 26 complaints (17 per cent) settled privately.
9.3 Termination of complaints
Of the 49 complaints that were terminated
by HREOC, 92 per cent were terminated on the ground that there was no
reasonable prospect of settlement. This means that just under one in
three of all complaints made (152 complaints) were terminated because
the parties could not reach agreement.
Complaints were also terminated because
HREOC considered that the behaviour was not unlawful (six per cent);
or the complaint was lacking in substance (two per cent)
Amongst the 49 terminated complaints,
26 were terminated after a conciliation conference was held and 23 were
terminated without a conciliation conference taking place.
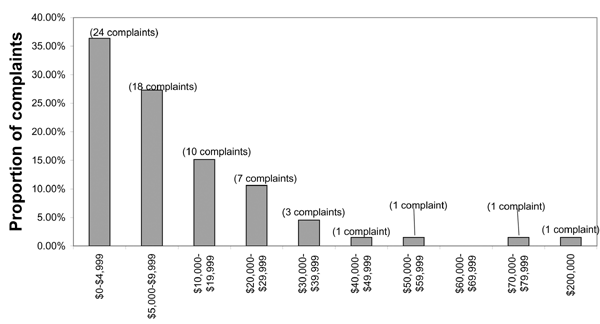
9.4 Financial compensation arising
from settlement
The amount of financial compensation
received by complainants varied widely, from a minimum of $500 to a
maximum of $200,000. The median financial payment obtained by sexual
harassment in employment complainants in 2002 was $6,250. [59] This amount is slightly above the median financial payment obtained
at conciliation of all complaints under the Sex Discrimination Act in
2001, which was $5,000. [60] Sixty-four per cent of sexual harassment in employment complainants
received less than $10,000 compensation at settlement.
Financial compensation from settlement
9.5 Who paid the compensation
As noted above at Section 2, employers
have a legal responsibility to take “all reasonable steps”
to prevent sexual harassment occurring in their workplace. A detailed
breakdown of compensation paid by employers versus individuals is not
available. In most cases, however, compensation was paid by the employer
rather than the individual alleged harasser.
In those cases where both the employer
and the alleged harasser agreed to pay compensation, the employer generally
paid a greater amount of compensation than the individual. For example,
amounts paid included $500 by the alleged harasser and $9,500 by the
employer; $5,000 by the alleged harasser and $10,000 by the employer;
and $3,000 by the alleged harasser and $2,216 by the employer.
It is important to note that compensation
by the employer arising from conciliation does not necessarily represent
an admission that harassment has occurred. There are many reasons why
an employer may choose to pay compensation including a desire to avoid
litigation and publicity of the case, to settle the dispute more quickly
or to minimise workplace disruption.
9.6 Relationship between financial
compensation and age of complainant
There was significant variation in
the median financial compensation received by complainants of different
ages. [61] In particular, the median amount received
by complainants aged 31-40 years was significantly higher than for other
age groups.
|
Age of complainants
|
Average financial compensation
|
Median financial compensation [62]
|
|
15 – 20 years
|
$6,356
|
$3,750
|
|
21 – 30 years
|
$10,149
|
$6,419
|
|
31 – 40 years
|
$48,393 [63]
|
$25,000 [64]
|
|
41 – 58 years
|
$11,278
|
$8,250
|
It is not possible from the available
data to explain the difference between the levels of financial compensation
received by age. However, the most likely explanation is that the settlement
was calculated by reference to the wage or salary of the complainant
and thus reflects differences in seniority within the workplace and
salary levels of different aged complainants. On a similar line, some
of the difference may also relate to whether the person paying the compensation
was an individual or an employer. [65]
9.7 Time taken to finalise complaints
The average time taken from receipt
of the complaint by HREOC to finalisation (whether settled through a
conciliation conference or privately, terminated or withdrawn) was 7.6
months. [66] For individual complaints, this ranged
from less than one week [67] to 29 months. [68] The median time taken to finalise the 152 complaints was seven months,
while the mode (most common time) was nine months. Forty-three per cent
of complaints were finalised in six months or less from the date of
receipt, while 12 per cent of complaints took more than 12 months to
be finalised.
9.8 Litigation
Of the 152 complaint files analysed,
17 complainants (11 per cent) pursued their terminated complaints by
making an application to either the Federal Magistrates Court or the
Federal Court of Australia claiming unlawful discrimination.
Twelve of these cases did not proceed
to hearing: six were settled, five were discontinued by the complainant
and one was vacated. Of the remainder, one is yet to be heard, [69] three were dismissed, [70] and one complaint was substantiated. [71] In the three applications dismissed, two were
dismissed with no orders made for costs. [72] The
other application was dismissed with the applicant ordered to pay the
respondent’s costs. [73] In the substantiated
complaint, the applicant was awarded damages in the sum of $10,000 plus
interest from the date of filing the application to the date of judgment
and exemplary damages in the sum of $7,500. Payment of these damages
was to be shared between the employer and the individual harasser.
Footnotes
20. There were 299 incidences
of the various types of harassment recorded for the 152 complaints.
21. Physical intimacy includes conduct such as giving
a complainant a shoulder massage, touching a complainant’s thigh
while sitting together, deliberately brushing up against a complainant’s
body, hugging, touching a complainant’s face or hair and trying
to hold a complainant's hand.
22. Sexual physical behaviour is physical behaviour
of a more sexual nature than that which has been defined as physical
intimacy. It includes kissing or attempting to kiss a complainant, touching
a complainant’s breasts or bottom and sexual assault.
23. “It is also clear that sexual harassment
constituted by conduct of a sexual nature can be the result of a single
act or single incident”: Johanson v Blackledge Meats [2001]
FMCA 6 citing Hall & Ors v A. A. Sheiban Pty Ltd & Ors (1989) EOC 92-250 and Leslie v Graham unreported, HREOC, 21
July 2000.
24. Complainants are not required to give their age
to HREOC. However, a voluntary survey asking demographic questions is
provided to complainants when they first lodge their complaints. One
of the questions on a later version of this survey asks the complainant’s
age. Not all complainants in this sample returned this survey. However,
the age of the complainant can sometimes be discovered in the body of
the complaint file.
25. ABS 6203.0 Labour Force Australia: August 2002 Commonwealth of Australia Canberra 2002, p23.
26. ABS 6203.0 Labour Force Australia: August 2002 Commonwealth of Australia Canberra 2002, p23.
27. Respondents are not required to provide demographic
information such as age to HREOC. However, the age of the respondent
can sometimes be discovered in the information on the complaint file.
In one of the 21 cases, age was provided as an age range and so has
not been included in calculations of the average age.
28. In some of these cases, the complainant stated
that the respondent was younger or older than the complainant.
29. See, for example, Straney v Brady (1994)
EOC 92-584"… the sense of oppressive authority that often
lies at the heart of allegations of sexual harassment is more likely
to be imparted in the context of a close employment relationship where
there is a wide disparity in ages between the older and younger employee"
and Elliot v Nanda [1999] EOC 92-989 “The conduct is
made worse by the age disparity between the parties...”
30. Australian Historical Population Statistics
– on AusStats (3105.0.65.001) and Migration, Australia
(3412.0) in ABS 1301.0 Year Book Australia 2003 Commonwealth
of Australia Canberra 2003, p132.
31. ABS data available on request, 1996 Census
of Population and Housing in ABS 1301.0 Year Book Australia
2003 Commonwealth of Australia Canberra 2003, pp132-133.
32. ABS data available on request, 2001 Census
of Population and Housing in ABS 1301.0 Year Book Australia
2003 Commonwealth of Australia Canberra 2003, pp145-146.
33. Not all complainants stated their employment status
in their complaint form, nor responded to the demographic survey. Also,
where employment status was provided by the complainant, it sometimes
differed from the employment status described by the respondent. In
these cases, it was usually the respondent’s description that
has been used in the analysis. Occasionally the complainant’s
work status could be inferred from the nature of the work undertaken
by the complainant, the hours worked and the industry classification.
Seven complainants were on probation when the harassment occurred.
34. In order to compare the complaints data with ABS
statistics it would be necessary to know whether the casual and fixed
term contract complainants worked full-time or part-time, and whether
the complainants who worked part-time and full-time were permanent employees,
casuals, or worked on contract.
35. There were 123 complaint files containing information
on the period of employment from when the complainant commenced employment
to when the first incidence of harassment occurred. One complaint where
harassment occurred during the job selection process and one complaint
where the harassment occurred immediately after the new owner of the
small business started have been excluded from the calculations included
here. Where the harassment occurred immediately upon the complainant’s
commencement of employment a value of zero was given.
36. Note that this calculation includes 16 per cent
of complainants (24 complainants) whose employment status was not known.
Of the 128 complainants whose employment status was known, 91 per cent
were no longer actively working for the organisation where the harassment
occurred.
37. These data are taken from the complainant’s
and respondent’s descriptions of the position occupied by the
complainant at the time of the harassment.
38. ABS 6203.0 Labour Force Australia: August 2002 ABS Canberra 2002, p46.
39. ABS 6203.0 Labour Force Australia: August 2002 ABS Canberra 2002, p46.
40. Note that there were occasionally more than one
respondent per complaint.
41. Excludes persons employed by public trading and
general government entities, and by businesses in the Agriculture, Fishing
and Forestry industries.
42. Small Business in Australia 2001 (1321.0)
in ABS 1301.0 Year Book Australia 2003 Commonwealth of Australia
Canberra 2003, p412. Note that Small Business in Australia is a biennial publication, with the next edition featuring 2003 data
due for release in 2004.
43. A number of complainants explicitly stated that
they worked in a workplace dominated by one sex (predominantly male-dominated).
It was also possible to infer the gender balance of some complainants’
workplaces in a limited number of cases. This inference is based on
the complainant’s description of the workplace, the complainant’s
description of co-workers and the industry the complainant worked in.
44. These complaints have been classified as unknown
and complaints in each industry have been calculated as a proportion
of all 152 complaints.
45. Section 13(2) of the Sex Discrimination Act provides
that sexual harassment committed by an employee of a State or an instrumentality
of a State is not covered by the Act. These complaints are dealt with
by the relevant State or Territory organisations. Given the high levels
of State provision of Education, Health and Community Services these
occupations will always be underrepresented in complaints to HREOC.
46. Note that some complainants reported harassment
to more than one reportee.
47. Note that this was the classification used by the
complainants. It has been included in this category with other forms
of senior management as it could not be classified as an individual
or direct manager.
48. An additional two cases have not been included
as question of whether the sexual harassment policy had been implemented
was in dispute between the parties.
49. See Section 7.1.
50. Human Rights and Equal Opportunity Commission Sexual
Harassment: A Code of Practice HREOC Sydney 1997, pp21-22. This
is also supported by the case law. In the case of Gilroy v Angelov [2000] FCA 1775, Justice Wilcox said that the development of a
brief document that pointed out what sexual harassment is, sanctions
attached to it and what an employee can do if they are harassed would
help an employer in a small business make out a defence to vicarious
liability.
51. The obligation on small businesses to take reasonable
steps to prevent sexual harassment is supported by the case law. “It
may be more difficult for a small employer, with few employees, to put
in place a satisfactory sexual harassment regime than for a larger employer
with skilled human resources personnel and formal training procedures.
But the [Sex Discrimination] Act does not distinguish between large
and small employers, and the decided cases show that many sexual harassment
claims concern small business, often with only a handful of employees”: Gilroy v Angelov [2000] FCA 1775 at [100].
52. There was one case where the existence of an internal
complaints process was disputed between the parties.
53. This could not be determined in 41 cases.
54. Note that some respondents were disciplined in
more than one way.
55. Other types of disciplinary proceedings included
demotion (nine per cent), salary increment delayed (three per cent)
and probation period extended (three per cent). The type of disciplinary
proceedings were not known in nine cases.
56. The alleged harasser was dismissed by the employer
in the one complaint where the complainant was satisfied with the workplace
process. The complainant pursued a complaint with HREOC against the
alleged harasser which went to conciliation. The outcome of the conciliation
was an apology from the alleged harasser (no compensation was sought).
57. See Section 9.8.
58. The remedy sought by the complainant was unknown
or not stated in 29 complaints.
59. A median rather than average measurement gives
a clearer picture of the financial compensation that complainants received,
as an average can be skewed by one or two extreme financial payments
linked to specific individual circumstances.
60. Human Rights and Equal Opportunity Commission Review
of Changes to the Administration of Federal Anti-Discrimination Law:
Reflections on the initial period of operation of the Human Rights Legislation
Amendment Act (No.1) 1999 (Cth) Commonwealth of Australia Sydney
2002, p11.
61. The complainant’s age was provided in 66
complaints.
62. A median rather than average measurement gives
a clearer picture of the financial compensation that complainants received,
as an average can be skewed by one or two extreme financial payments
linked to specific individual circumstances.
63. Note that a payment of $200,000 was made to a 34
year old woman. As this payment is significantly higher than most other
compensation payments it does skew the results for this age group slightly.
Removing this payment from the calculation results in an average payment
of $23,125 for 31-40 year old complainants, which is still significantly
higher than other age groups.
64. Excluding the payment of $200,000 from the calculation
results in a median payment of $22,500 for 31-40 year old complainants.
65. A detailed breakdown of compensation paid by employers
versus individuals is not available. See Section 9.5 for further discussion
of payment by employers versus individuals.
66. For all complaints to HREOC in 2001-2002, 88 per
cent of matters were finalised within 12 months from the date of receipt
and the average time from receipt to finalisation of a complaint was
seven months. Human Rights and Equal Opportunity Commission Annual
Report 2001-2002 HREOC Sydney 2002, p40.
67. The complaint was withdrawn within six days of
its receipt.
68. The complaint settled at a conciliation conference
with the employer agreeing to pay the complainant $30,000 in full and
final settlement of the complaint.
69. The case was listed for a directions hearing on
29 October 2003.
70. Maurmo v The House of the Bride & Ianotti unreported Federal Magistrates Service 4 March 2003, Fox v Gay &
Boyd Hotel, unreported Federal Magistrates Service 6 August 2003
and Daley v Barrington & Wright & NSW Greyhound Breeders,
Owners and Trainers Association [2003] FMCA 93.
71. Font v Paspaley Pearls & Ors [2002]
FMCA 142.
72. Maurmo v The House of the Bride & Ianotti unreported Federal Magistrates Service 4 March 2003 and Fox v Gay &
Boyd Hotel unreported Federal Magistrates Service 6 August 2003.
73. Daley v Barrington & Wright & NSW Greyhound
Breeders, Owners and Trainers Association [2003] FMCA 93.
74. Font v Paspaley Pearls & Ors [2002]
FMCA 142.
Last
updated: 12 November 2003
